
An analysis of mWater’s major feature release and its impact on the future of water, sanitation, and hygiene (WASH) programming.
Summary
The first half of 2026 marks a pivotal moment for digital WASH operations. mWater has introduced a coordinated set of features that address persistent barriers to data-driven decision-making, including technical complexity, system fragmentation, information overload, and limited access to advanced analytical tools for non-specialists. With over 25 product enhancements, funded in part by UNICEF Madagascar and already in use across national programs, this release significantly broadens data accessibility, system connectivity, and decision-making capabilities. (mWater's Impacts, 2026)
In a sector where 2.1 billion people lack safe drinking water, 3.4 billion lack safe sanitation, global non-revenue water losses reach US$14 billion annually, and SDG 6 progress is “far off track” (Work on Grid, 2024), these features have significant implications. The advancements described here, AI-powered dashboard design, natural-language data integration, interactive controls, and expanded language support, are not minor upgrades. They are structural enablers that shift analytical capacity from routine data preparation to the generation of actionable insights.
I. The Landscape: Why Digital Transformation in WASH Can No Longer Wait
The evidence base for urgent digital modernization in the water, sanitation, and hygiene sector has never been stronger. The WHO/UNICEF GLAAS 2025 report, launched in January 2026 at the High-Level Preparatory Meeting for the UN Water Conference, examined the status of key components of WASH systems across 105 countries and 21 development partners, with an expanded analysis of the means of implementation for SDG 6. Its conclusion is unambiguous: weak monitoring, inadequate use of data for decision-making, and fragmented information systems remain binding constraints on sector performance. (Organization & Fund, n.d.)
Critical pressures shaping WASH operations in 2026:
Persistent access gaps. Despite decades of investment, basic service coverage remains incomplete. The UN World Water Development Report 2026, released for World Water Day 2026, reaffirms that universal water security cannot be achieved without closing deep-seated inequalities, including gender gaps that see women and girls spending over 250 million hours daily on water collection. (The United Nations World Water Development Report 2026: Water for All People – Equal Rights and Opportunities, n.d.)
Climate-driven operational stress. Across Africa, climate change is intensifying long-standing vulnerabilities, including prolonged droughts in the Horn of Africa, severe flooding in the Sahel, and deepening water shortages in Southern Africa. Infrastructure is being expanded without climate safeguards, exposing populations to growing flood, drought, storm, and sea-level risks.
Utility performance deficits. Non-revenue water remains a chronic drain on financial and water resources. The World Bank has noted that cutting NRW in half across emerging-market utilities could unlock over US$2.9 billion in cash, benefiting an additional 90 million people. (Kingdom et al., 2016) Yet effective NRW reduction depends on real-time monitoring, data integration, and predictive analytics, which are capabilities that remain out of reach for many utilities due to fragmented digital infrastructure.
Asset management failures. In Nepal, a recent Frontier Tech Hub pilot found that while 95 % of households have access to improved water sources, only around a quarter of water supply schemes are fully operational at any given time, largely because poor-quality data makes it impossible to prioritize repairs. Two-thirds of asset records contained inaccuracies. AI-assisted validation has proven capable of detecting faults with accuracy comparable to human validators (exceeding 95 % for many asset types), but only where data systems can accommodate such tools. (S. & C., 2023)
The imperative of interoperability. The World Bank Group’s Digital Water program explicitly supports utilities to incorporate digital solutions, including smart metering, data integration, GIS, predictive maintenance, and an array of software platforms into their workflows. The underlying requirement across all of these is system connectivity, the ability for field data platforms to act as live data backbones rather than isolated collection tools. (About us, 2024)
As these challenges persist, sector progress remains slow. Billions still lack services, climate impacts intensify, utility performance is hindered by fragmented data, and real-time decision support remains limited.
II. Our Product Evolution in 2026: A Coordinated Response to Sector Constraints
The features introduced in early 2026 provide an integrated response to the sector’s main constraints. The following analysis reviews each major capability, detailing its purpose, technical function, impact, and strategic value.
2.1 AI-Powered Dashboard Design: From Specialist Tool to Conversational Intelligence
Historically, effective data analysis in WASH required scarce resources: skilled data scientists, expensive software, and long deployment cycles. As a result, valuable field data often remained underutilized and failed to inform real-time decisions.
While digital data collection is widespread, the ability to convert raw survey responses into actionable visualizations remains limited to specialist teams. As WASH programs become more complex and reporting demands increase, the main bottleneck has shifted from data collection to data interpretation.

Released in April 2026, this feature embeds a conversational AI interface directly into the dashboard design workflow. Rather than requiring users to navigate complex query builders or understand underlying data schemas, they can describe the chart, map, or pivot table they need in plain language. The AI translates that intent into the same powerful underlying data configurations that expert users would construct manually, helping ensure the output is analytically rigorous. Users retain full control to review, edit, and refine any AI-generated configuration at any time.
This feature allows users to create charts, pivot tables, maps, and calculated indicators using natural language. The AI maintains full analytical capabilities, provides an alternative interface, and supports manual edits. It efficiently interprets data schemas and builds complex expressions, making it a valuable tool during workshops.
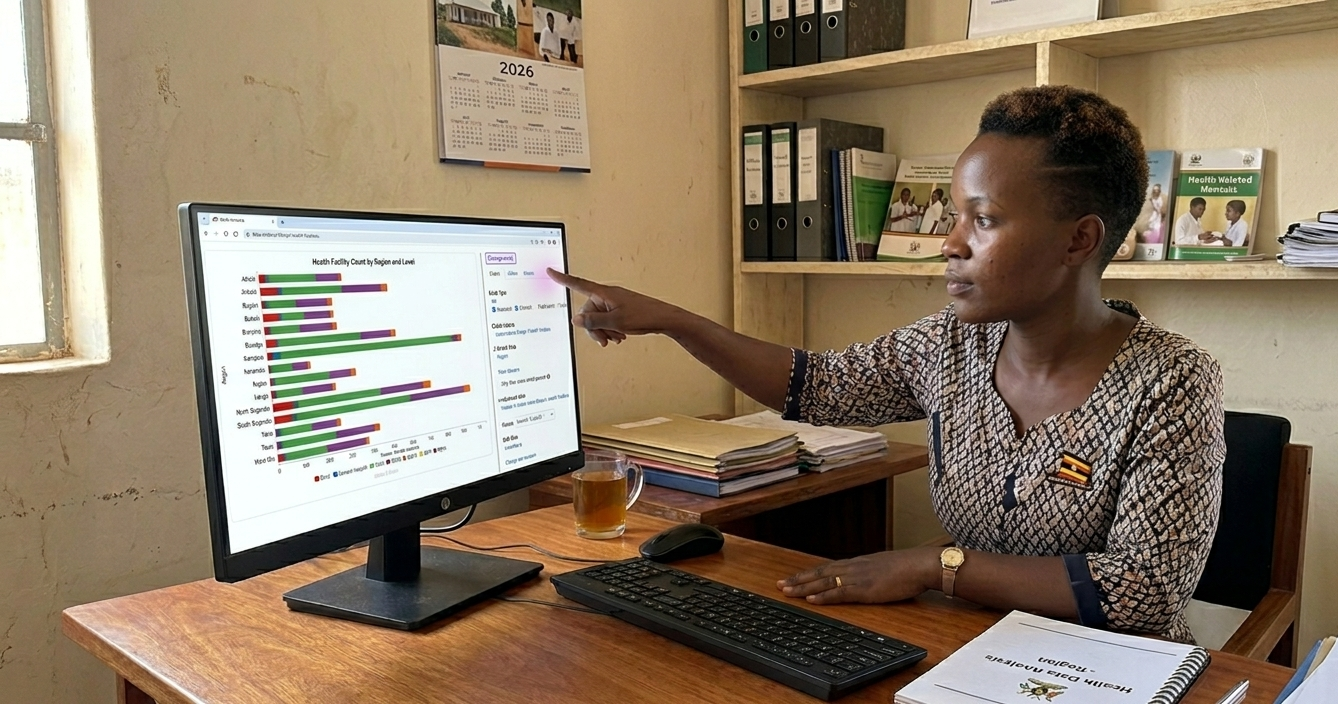
For example, a district water officer in rural Uganda without data analysis training can now request a breakdown of non-functional boreholes by sub-county for the past year and receive a publication-ready visualization within minutes.
mWater has seen the Government of Zimbabwe, through the Ministry of Health, make great use of these features in building its national MIS, which receives quarterly WASH survey data from more than 1,187 health facilities across 63 districts. Previously, producing a district-level functionality dashboard required a dedicated data analyst working for several days. Using an AI-powered dashboard design, a program officer can ask, “Show me a bar chart of non-functional water points at the facilities per district, coloured by the most common repair type needed, with a table of the ten worst-performing facilities,” and have the complete dashboard ready for sharing within minutes.
Expected outcomes
Organizations using this capability can reduce dashboard development time from weeks to hours. By removing technical barriers, analytical ownership shifts to program teams, enabling M&E officers, district managers, and sector coordinators to independently build and maintain dashboards. This decentralization represents a structural change in WASH operations.
AI-assisted analytics do not replace data professionals. Instead, these tools let professionals focus on higher-value tasks, such as designing indicator frameworks, validating models, and generating insights, while field staff handles routine queries. This approach significantly expands analytical capacity across the organization. To support a smooth adoption of these capabilities, mWater provides dedicated training materials, onboarding webinars, a WhatsApp channel for instant updates, and help resources that ensure staff at all levels can quickly become proficient with new features. Organizations can access step-by-step guides, live webinars, and on-demand support to promote staff readiness and maximize the benefits of these tools.
2.2 The mWater MCP Server
A key exciting development in mWater’s 2026 product line is the public release of the Model Context Protocol (MCP) server. This server allows users to securely connect AI assistants, such as Claude Desktop, Cursor, OpenAI Codex, and other MCP-compatible tools, directly to their mWater accounts.
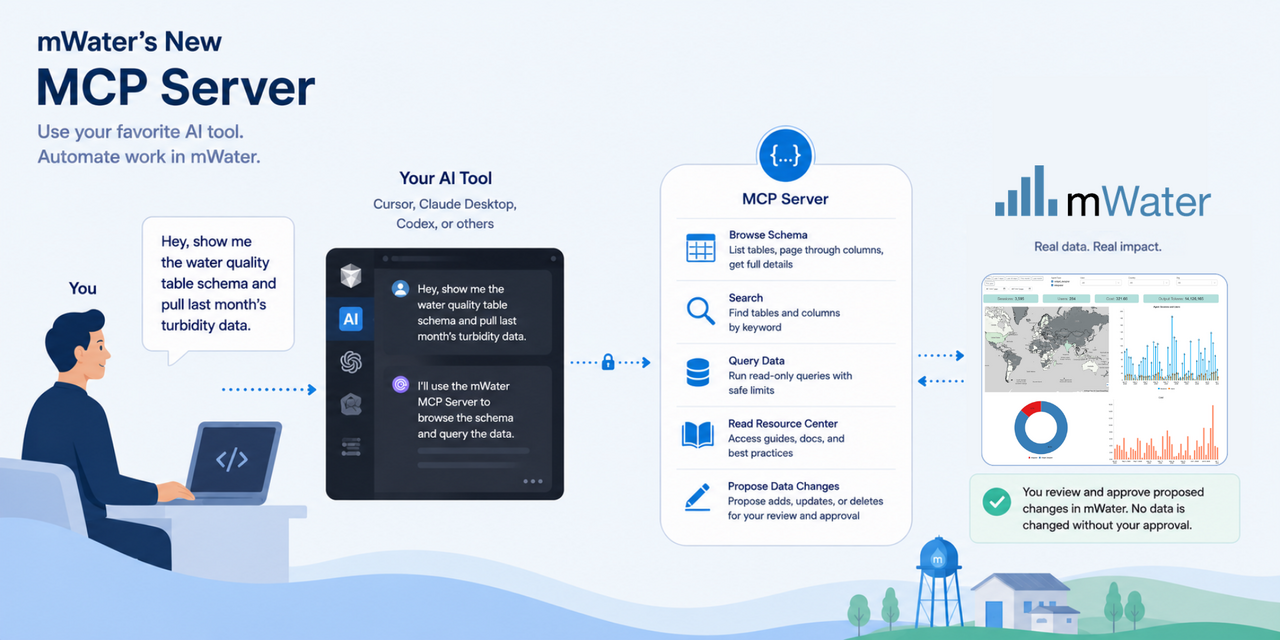
The MCP server uses a robust human-in-the-loop governance model. AI assistants inherit only the user’s permissions, operate in a read-only environment by default, and cannot modify data directly. Any proposed additions, updates, or deletions require manual review and approval before implementation, ensuring organizations maintain full control over their information.
Early adopters have used this feature to support duplicate detection, perform qualitative text analysis, investigate data integrity issues, generate custom visualizations outside the mWater-provided visuals, and interact with mWater’s knowledge base through live question-and-answer sessions.
The MCP server is a major step toward conversational data management. As AI assistants become standard interfaces for digital systems, mWater’s adoption of the open MCP standard ensures compatibility with a growing ecosystem of AI tools while maintaining security, transparency, and oversight.
The MCP server advances mWater’s vision of democratizing analytics and decision-making. Just as AI-powered dashboards discussed above reduced barriers to data visualization, the MCP server lowers barriers to data exploration, allowing users to engage with monitoring information through conversation.
Read more about the server in the mWater resources center
2.3 The Integrator: Connecting mWater to the World
Data must flow freely between systems to realize its full value. WASH organizations often use multiple platforms, including financial management, HR, health information, GIS, IoT sensors, and donor reporting systems. Historically, integrating these systems required custom, costly, and fragile data pipelines.
The World Bank’s Digital Water program identifies data integration as essential for utility digital transformation. While real-time tools are powerful enablers, the lack of connectivity remains a major constraint. As organizations shift to live data ecosystems, seamless data movement between platforms is now the primary barrier to digital maturity.
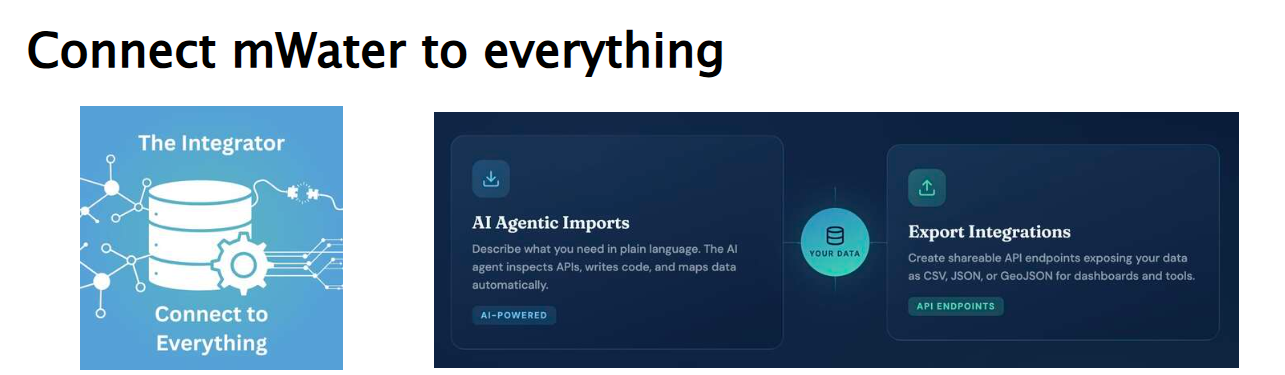
The Integrator, funded by UNICEF Madagascar’s MERL program, provides two complementary capabilities that together address the full spectrum of data connectivity needs. AI Agentic Imports allow organizations to pull data from external APIs directly into mWater, without writing code. Users describe what data they want to import and from where; the AI agent inspects the external API, writes the necessary integration code, maps fields to mWater’s schema, and presents a preview. Export Integrations publish mWater data as live, accessible endpoints that external systems can consume: Power BI dashboards, Tableau visualizations, Google Sheets, custom-coded management information systems, and GIS mapping tools can all draw directly from mWater via secure, configurable URLs that refresh automatically as underlying data changes. All data transfers during integrations are protected by industry-standard encryption and strict access controls, ensuring that sensitive information remains confidential and secure throughout the integration process.
The AI agent manages authentication, handles pagination for large datasets, supports incremental imports, and can be refined using natural language feedback. Export endpoints support CSV, JSON, and GeoJSON formats, with configurable columns, filters, and parameterized queries.
An organization managing IoT-enabled water point sensors no longer needs a developer to build and maintain a data pipeline. They describe the integration in plain language, the AI handles the complexity, and the data begins flowing automatically on a schedule, with incremental updates. Conversely, a national ministry that needs to share district-level functionality data with a donor’s Power BI portal can create a single export URL, share it once, and know the donor will always see the latest data.
Imagine a water utility in East Africa, Kenya, operating 500 smart meters that provide hourly flow data through a third-party API. The utility’s M&E team wants to combine this sensor data with their asset inventory and maintenance records in mWater to produce a real-time dashboard of network performance. Using AI Agentic Imports, they describe: “Import hourly flow readings from https://api.smartmeter.co.ke/readings (not a real site) for the last seven days, update every six hours, and map sensor_id to water_point_id in our sites table.” The AI agent inspects the API, writes the integration code, and begins populating a custom table. Simultaneously, an export integration makes the consolidated dataset available to the utility’s financial system for NRW reconciliation. This is all configured in minutes, not weeks.
Expected outcomes
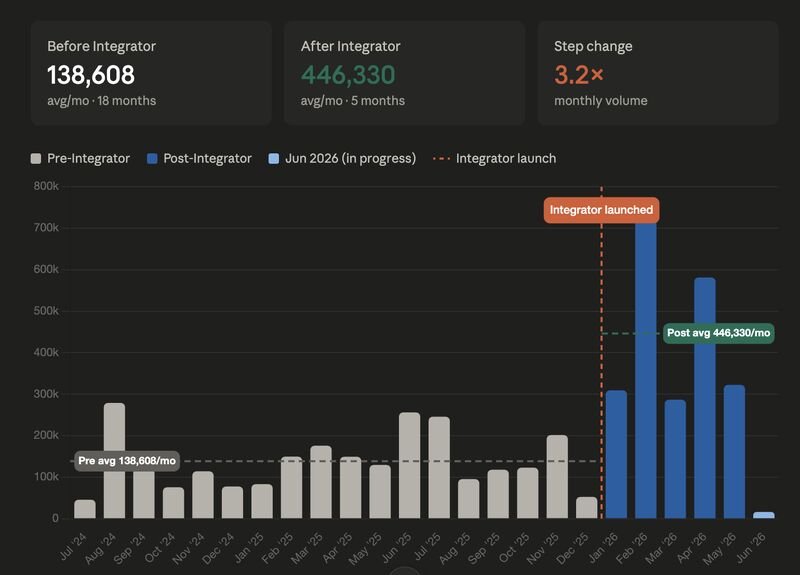
End-to-end integration time drops from weeks or months to minutes. (The Integrator, 2026) Data silos are removed, with mWater acting as a live data backbone. Maintenance is simplified so that if an external API changes, users can ask the agent to update the integration without having to rewrite code.
The Integrator makes mWater an active part of broader digital ecosystems. Instead of requiring all data to reside within mWater, it supports a best-of-breed architecture that integrates field monitoring and survey collection with specialized systems for finance, GIS, analytics, and reporting. This interoperability underpins sustainable digital transformation.
2.4 Slicers: Interactive Dashboards Without Technical Overhead
Static dashboards that require administrators to adjust filters for each query create bottlenecks. Users need to explore data independently, filtering by geography, time, program component, or other dimensions without disrupting dashboard design.
As WASH dashboards serve diverse stakeholders, the need for self-service interactivity has grown. Traditional dashboard tools often restrict filtering controls to fixed locations and offer limited support for cascading or cross-table filtering.
Released in April 2026 and funded by UNICEF Madagascar, Slicer widgets give dashboard consumers direct control over the data they see, without touching the underlying configuration. Users can filter by categorical options, numerical ranges, dates, or entirely custom parameters, with controls rendered as buttons, radio buttons, checkboxes, dropdowns, or sliders.
This implementation stands out for its intelligent slicer interconnection model. Slicers are cascading: a province-level slicer automatically narrows a district-level slicer to relevant districts. Cross-table filtering lets a single slicer filter widgets from different data sources, a capability that previously required complex configuration. Slicers can be placed anywhere in the dashboard, allowing contextual controls next to the widgets they manage.
For national-level WASH monitoring dashboards serving multiple stakeholders with different geographic and programmatic mandates, Slicers allow a single dashboard to serve all audiences – each user self-selecting the data view relevant to their context without requiring separate dashboard instances.
Expected outcomes
User satisfaction increases as stakeholders gain direct control over data views. Dashboard administrative overhead drops, as designers no longer need to create multiple variants for different audiences. Analytical exploration becomes faster and more intuitive. (Using dashboards, 2026)
Slicers shift dashboards from static presentations to interactive inquiry tools. Users can ask follow-up questions, refine their focus, and explore relationships without leaving the dashboard or needing technical support.
2.5- Dashboard Sections: Structure at Scale
As WASH programs become more complex, dashboards must expand as well, often making a single scrolling canvas unmanageable. Loading all data for every dashboard component at once creates performance issues, especially in low-bandwidth environments.
Field operations often occur in areas with limited internet connectivity. Slow-loading or bandwidth-heavy dashboards are unusable in these settings. Historically, designers had few options for managing data loading beyond splitting dashboards into multiple tabs.
Released alongside Slicers, Dashboard Sections enable designers to organize complex dashboards into discrete thematic areas presented as tabs, sidebars, or accordion panels without fragmenting data across multiple separate dashboards.
Performance optimization is critical. By rendering only active sections, dashboards with many widgets remain responsive even on slow connections. Sections also support different stakeholder experiences within a single dashboard, allowing each audience to access the most relevant view.
Expected outcomes
Dashboard usability improves, especially in low-bandwidth settings. Designers can build comprehensive monitoring systems without sacrificing performance. User adoption rises as dashboards become faster and easier to navigate. Check this demo site. https://go.mwater.co/demo_dashboard
2.6 Drilldowns: From Aggregate to Action
Aggregate data shows program managers where to focus, but understanding the reasons behind underperformance or identifying specific sites requires drilling down from summary to detail. Historically, this required separate dashboards for each level or manual filter adjustments, making deep investigation cumbersome.
Navigating from national summaries to individual site records is essential for operational management. However, most dashboard tools treat drilldown as secondary, requiring custom configuration for each navigation path.
Released in May 2026, drilldowns transform any chart, map, pivot table, or calendar widget into an entry point for deeper investigation. When a user clicks a region on a map, a bar in a bar chart, or a cell in a pivot table, the dashboard transitions to a focused view that unpacks the specific selection, automatically filtering to show only the data relevant to the click.
The navigation logic is hierarchical and recursive: a national-level map drills down to a regional view, which drills down to districts, which drill down to individual sites. A timeline chart showing annual program performance, drilling down to quarterly detail, then to monthly detail. At each level, the full suite of dashboard widgets updates to reflect the selected context.
Now, a single cohesive dashboard supports the entire process from aggregate program overview to individual site inspection, with all transitions handled automatically and intuitively. Separate dashboards or manual filter adjustments are no longer needed.
For example, a national water program manager reviews a map of district-level functionality rates. After identifying a district below target, the manager clicks on it, and the dashboard updates to show all relevant data for that district. Further clicks drill down to sub-districts and individual water points, revealing detailed maintenance histories. This process takes seconds instead of hours.
2.7 Map Extent Filtering: The Map as a Control Surface
Interactive maps have traditionally served as visualization tools, displaying locations of water points, health facilities, schools, and other assets. However, they have rarely functioned as filtering interfaces. Users typically had to adjust separate controls to view data for a specific area, breaking the intuitive link between spatial navigation and data exploration.
Geospatial analysis is increasingly central to WASH management. Donors require location-tagged reporting; utilities manage distribution networks across administrative boundaries; NGOs coordinate interventions across catchment areas. A dashboard that does not treat geography as a primary analytical dimension is incomplete.
Released in May 2026, Map Extent Filtering enables any map widget in a dashboard to serve as a slicer for all other widgets within its section. When a user pans or zooms the map to a specific area, all connected widgets, tables, charts, indicators, and pivot tables automatically update to reflect only the data for sites and areas currently visible on the map canvas.
This feature integrates with mWater’s existing map infrastructure, using the platform’s geospatial capabilities to identify assets within the current map view. Filtering occurs in real time as users navigate.
For example, during a district-level review meeting, a water officer opens a dashboard showing all water points in the region. As she zooms into a specific community, charts automatically update to display functionality rates, maintenance backlog, and recent repairs for that area. Panning to another area updates the charts, enabling exploration of geographic variations without reconfiguring filters.
2.8 Admin Region Questions: Precision Geographic Targeting
National monitoring frameworks must aggregate upward through multiple administrative tiers from communities to sub-districts to districts to provinces to the national level. The ability to collect data at the appropriate administrative level and compare it across tiers is a fundamental requirement for sector performance management.
Released in May 2026, the Admin Region question type allows survey forms to capture administrative regions as a direct response type, connecting submissions to mWater’s comprehensive library of administrative boundaries at communal, sub-district, district, regional, and provincial levels.
Once responses are linked to administrative regions, they can be visualized at the correct level without extra data processing. Admin Region questions address a key gap in field monitoring platforms. By treating administrative geography as a primary data type, mWater enables organizations to manage both point-based assets and regionally aggregated targets within a unified framework.
2.9 PDF, Document, and File Uploads: The End of the Data Silo
Field data collection is only part of the operational record. Contracts, inspection certificates, maintenance reports, photos, and other supporting documents are equally important but were historically difficult to attach directly to survey responses or site records.
Compliance requirements increasingly demand comprehensive documentation. Auditors expect both data and supporting evidence. However, data collection platforms and document management systems have remained separate, forcing staff to maintain parallel systems.
Released in April 2026, File Questions in surveys allow respondents to attach any file format: PDF, Word document, spreadsheet, image, video, etc. directly to a survey submission. These attachments are stored and associated with the response or site record they belong to, making the full documentation trail accessible within mWater alongside the structured data it supports.
Attachments are stored securely and linked to the relevant survey response or site. They can be viewed, downloaded, and managed through the same interface as structured data, removing the need for separate document management workflows.
File Questions acknowledge that program management involves both structured and unstructured information. By supporting both in a unified platform, mWater enables organizations to move from data collection to comprehensive program record management.
2.10 Dark Mode and Language Expansion: Designing for the Field
Product design for development programs must meet criteria different from those for consumer software. Field operability, including usability under challenging lighting conditions, with limited battery power, and in local languages, is essential.
The introduction of a standard dark theme for dashboards (May 2026) addresses field conditions by reducing screen brightness and glare during extended sessions and lowering energy consumption on OLED/AMOLED screens to extend battery life.
Equally important, expanding the supported interface languages makes mWater more accessible across diverse geographies. As of June 2026, mWater dashboards and survey forms are available in English, French, Spanish, Portuguese, Arabic, Swahili, Chinese (Simplified), Tagalog, Bahasa Indonesia, and Vietnamese, among others. This enables local government staff, community enumerators, and national teams to use the platform in their preferred language, improving data quality and adoption.
2.11 Foundational Enhancements: In addition to flagship releases, the first half of 2026 introduced improvements that enhance the performance, usability, and security of the mWater platform:
Data Source View: provides transparency into which data sources are in use, available but unused, or removable, essential for dashboard governance over longer periods.
Header Hyperlinks enable navigation between dashboard sections and external resources directly from the dashboard interface.
Roster Import/Export provides a manageable workflow for roster-heavy instruments used in facility assessments and household surveys.
Two-Factor Authentication (January 2026) provides an optional security enhancement for organizations managing sensitive population-level data.
View Site from Response simplifies navigation from survey responses to corresponding site records.
III. Connecting the Dots: An Integrated Digital Ecosystem
Each feature described above addresses a specific operational challenge. Together, they form a coherent digital ecosystem that fundamentally changes how WASH organizations manage programs.
The Integrator removes data silos, allowing mWater to serve as a live backbone for financial, operational, geographic, and reporting systems. AI-powered dashboard design and Drilldowns make analytics widely accessible. Slicers, Sections, and Map Extent Filtering turn dashboards into interactive inquiry tools. Admin Region questions and File Uploads address key data modeling gaps. Dark mode and language expansion ensure usability in the field and across local contexts.
As a result, the platform now excels in three key areas: analytical accessibility, system connectivity, and operational adaptability.
IV. The Future of Digital WASH Operations
The capabilities released in the first half of 2026 signal a broader direction for digital WASH management.
AI-assisted decision-making will become the standard, not the exception. As natural language interfaces become the main method for dashboard creation and data integration, the distinction between technical and non-technical users will diminish. Field staff, program managers, and government counterparts will increasingly interact with data systems through conversation rather than configuration.
Integrated data ecosystems will replace isolated platforms. Seamless connection of field data with IoT sensors, financial systems, GIS platforms, and donor reporting will become standard. Organizations will shift from single-vendor solutions to best-of-breed architectures with standardized interfaces.
Asset intelligence will enable predictive maintenance. As AI models for fault detection reach over 95% accuracy in real-world pilots, automatic identification of infrastructure failures from photos and sensor data will shift maintenance from reactive to predictive. Organizations that integrate image and sensor data into core monitoring platforms will benefit first.
Real-time monitoring will become standard. Automated data imports, interactive dashboards, and responsive filtering will shift organizations from periodic reporting to continuous situational awareness. Program managers will identify and address performance issues as they arise.
Citizen engagement will increase. As dashboards become more interactive and accessible, tools used by program managers can also serve communities. Citizens will be able to view service performance, report issues, and track progress within a shared data infrastructure.
Advanced analytics will become mainstream. As AI-powered dashboard design lowers barriers, more organizations will adopt advanced techniques such as predictive modeling, geospatial analysis, and trend detection, because field staff can request them in plain language.
V. Key Takeaways
The main constraint in WASH is shifting from data collection to data analysis. Field data is abundant, but analytical capacity is limited. Features that simplify dashboard creation and data integration address the most significant bottleneck in program management.
Interoperability is essential for digital maturity. No single platform can meet all needs. Successful organizations will seamlessly connect best-of-breed tools, and mWater’s Integrator makes this connectivity accessible without specialized development resources.
Dashboards should be conversational, not static. Interactive features like Slicers, Drilldowns, and Map Extent Filtering transform dashboards from reports into inquiry tools, allowing users to explore questions naturally instead of relying on predetermined views.
Democratizing data intelligence is both feasible and urgent. When district water officers build their own dashboards, M&E teams configure data imports without code, and national ministries deploy localized interfaces, analytical capacity is fundamentally redistributed across the organization.
VI. Conclusion
In the first half of 2026, mWater delivered some of its most significant product cycles, expanding data accessibility, system connectivity, and decision-making capabilities.
The implications for the sector are clear. Tools to transform field data into operational intelligence and connect it to relevant systems and stakeholders are now available. Most of the features outlined in this release are included within the standard mWater platform offering at no additional cost to partners. A small number of advanced integrations and customization options may require additional costs or partnership agreements, depending on the scope and requirements of each organization.
mwater.co | Data-driven Management for Water, Sanitation and Health
References
(2026). mWater's Impacts. mWater. https://www.mwater.co/impact
(n.d.). The United Nations World Water Development Report 2026: Water for All People – Equal Rights and Opportunities. https://shop.un.org/books/world-water-dev-rpt-2026-27642
Kingdom, B., Soppe, G. & Sy, J. (August 31, 2016). What is non-revenue water? How can we reduce it for better water service?. World Bank. https://blogs.worldbank.org/en/water/what-non-revenue-water-how-can-we-reduce-it-better-water-service
S., D. & C., I. (2023). Integrating AI into the asset management of rural water supply schemes in Nepal. Frontier Tech Hub. https://www.frontiertechhub.org/pilot-portfolio/ruralwaterschemes-nepal
(2024). About us. World Bank Digital Water Program. https://www.worldbank.org/en/programs/digital-water/about-us
(n.d.). Using dashboards. mWater Portal Resource Center. https://portal.mwater.co/resource_center/report_dashboards.
(2026). The Integrator. mWater Portal Resource Center. https://portal.mwater.co/resource_center/integrator